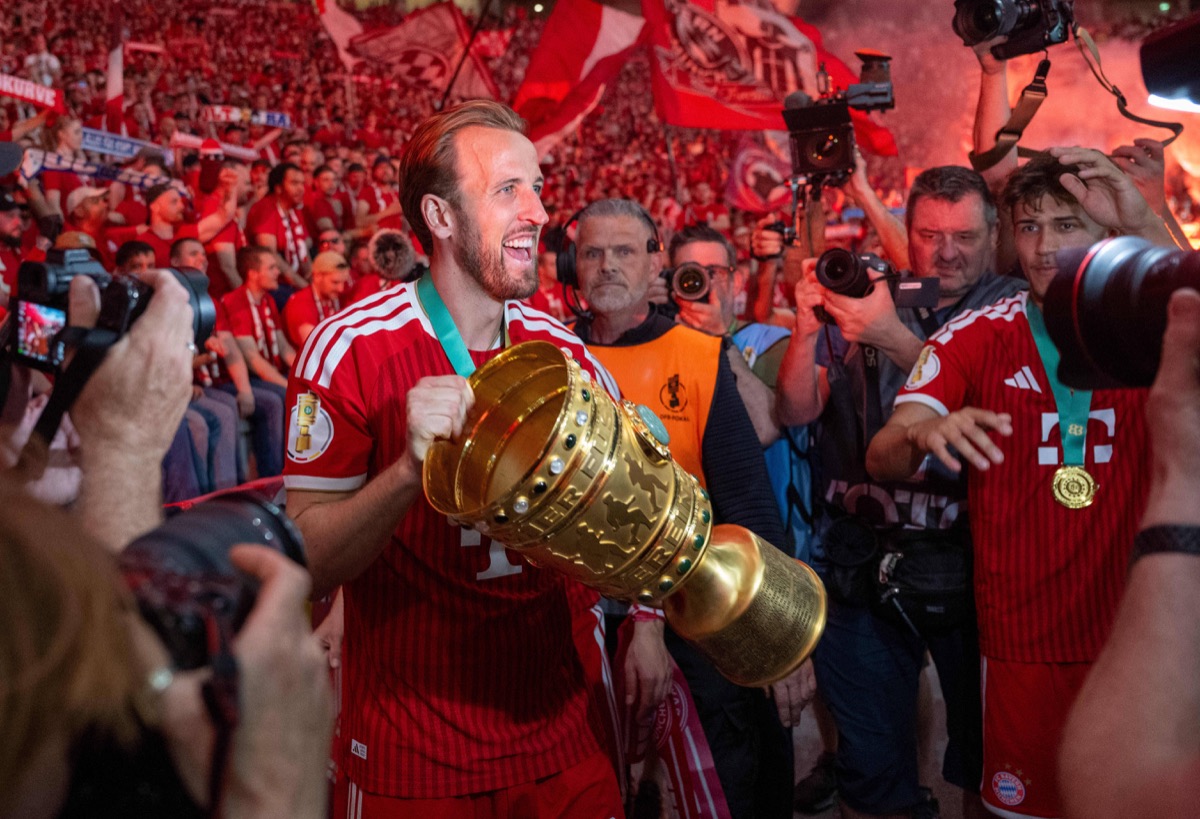
Paris · 2025 and 2026
Paris,
again.
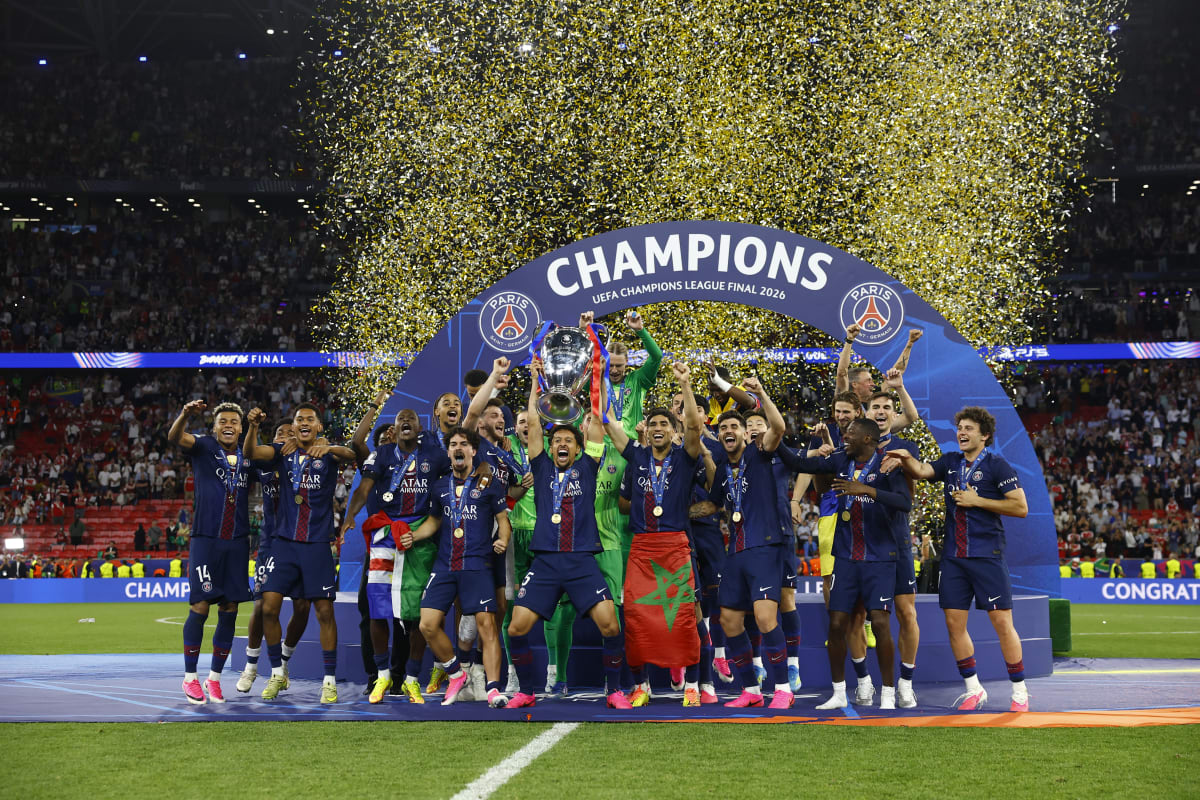
Liverpool went out without scoring. Bayern put five past Paris across two legs and still went out. PSG kept the Champions League trophy and won Ligue 1 with 76 points.
See PSG’s league season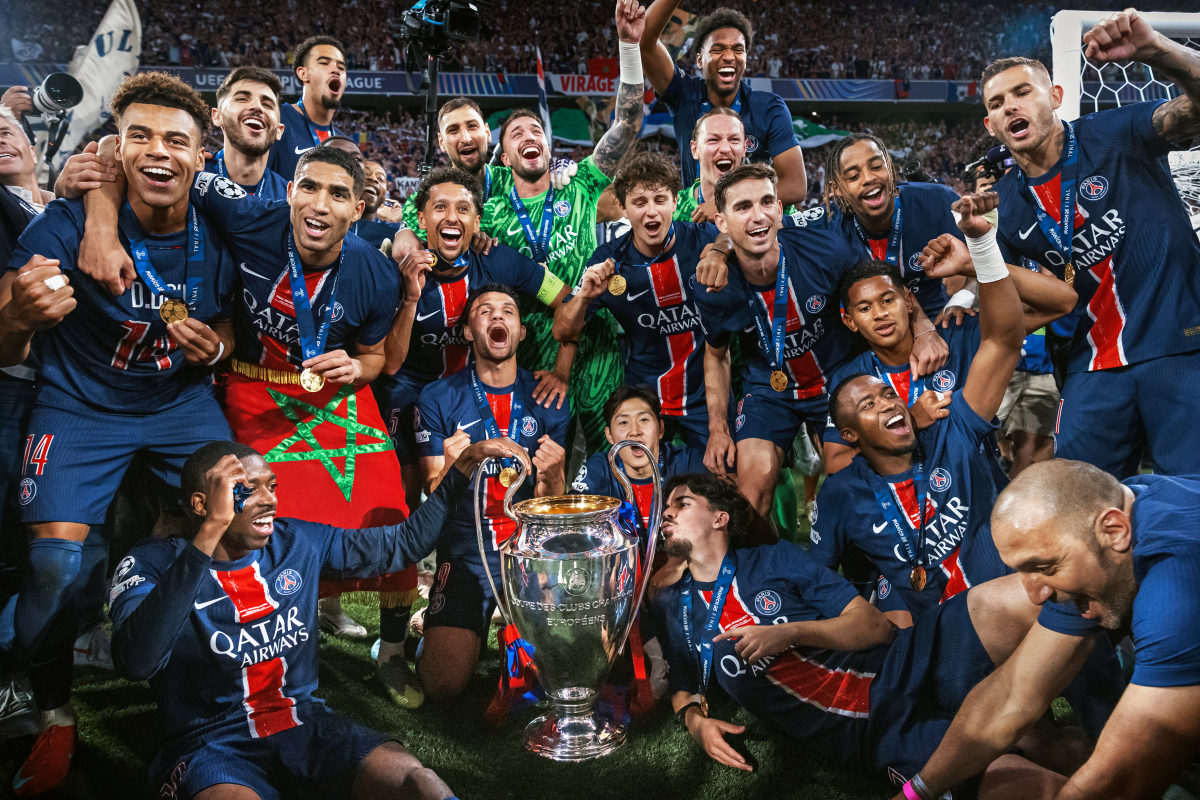
The Football Archive · Cover story
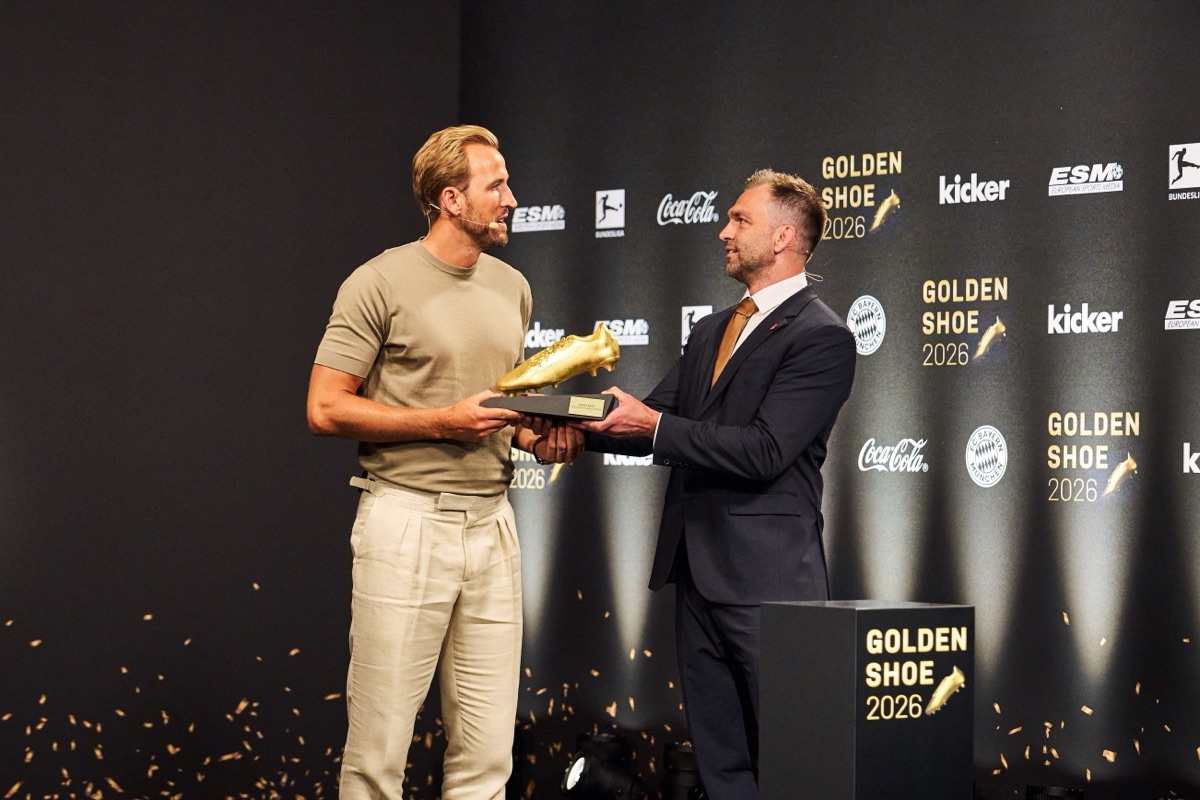
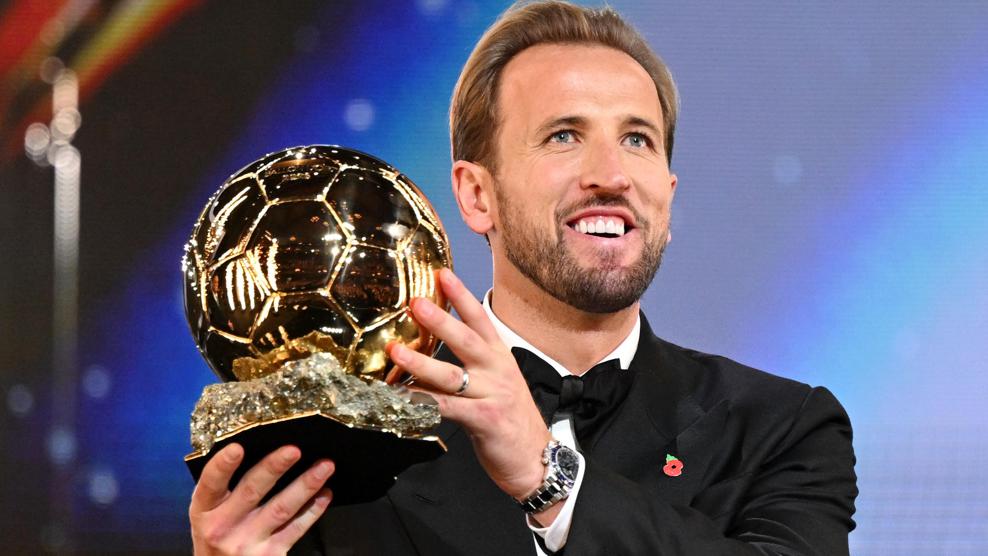
Spurs knew him as the academy kid who broke Jimmy Greaves’ record. In October, Harry Kane was back in London with the Ballon d’Or in his hands.
01 / The cover story
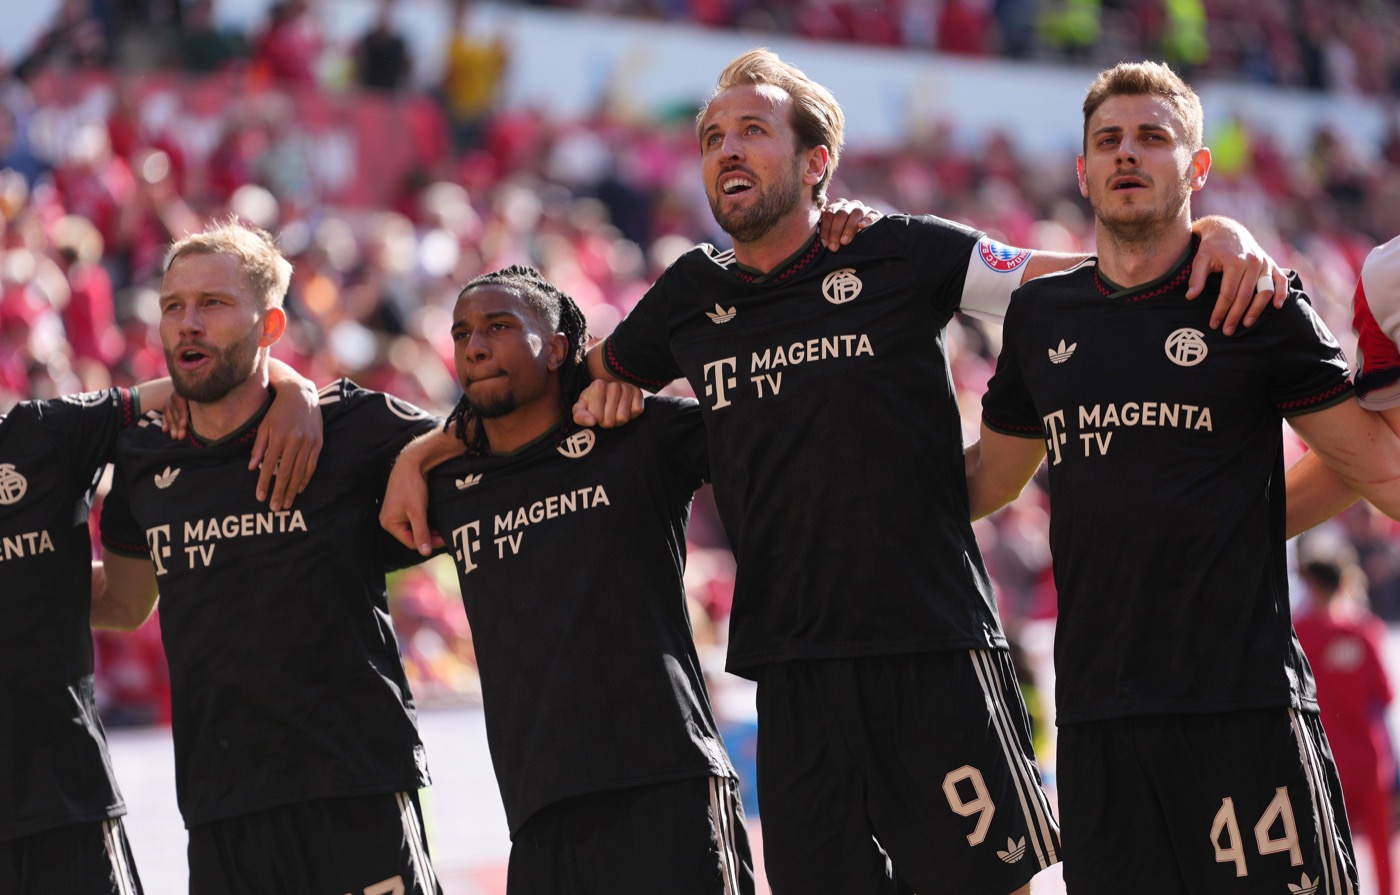
Bayern sent Kane on at half-time in Mainz with three goals to find. Nicolas Jackson, Michael Olise and Jamal Musiala brought them level. Kane made it 4–3 in the 83rd minute.
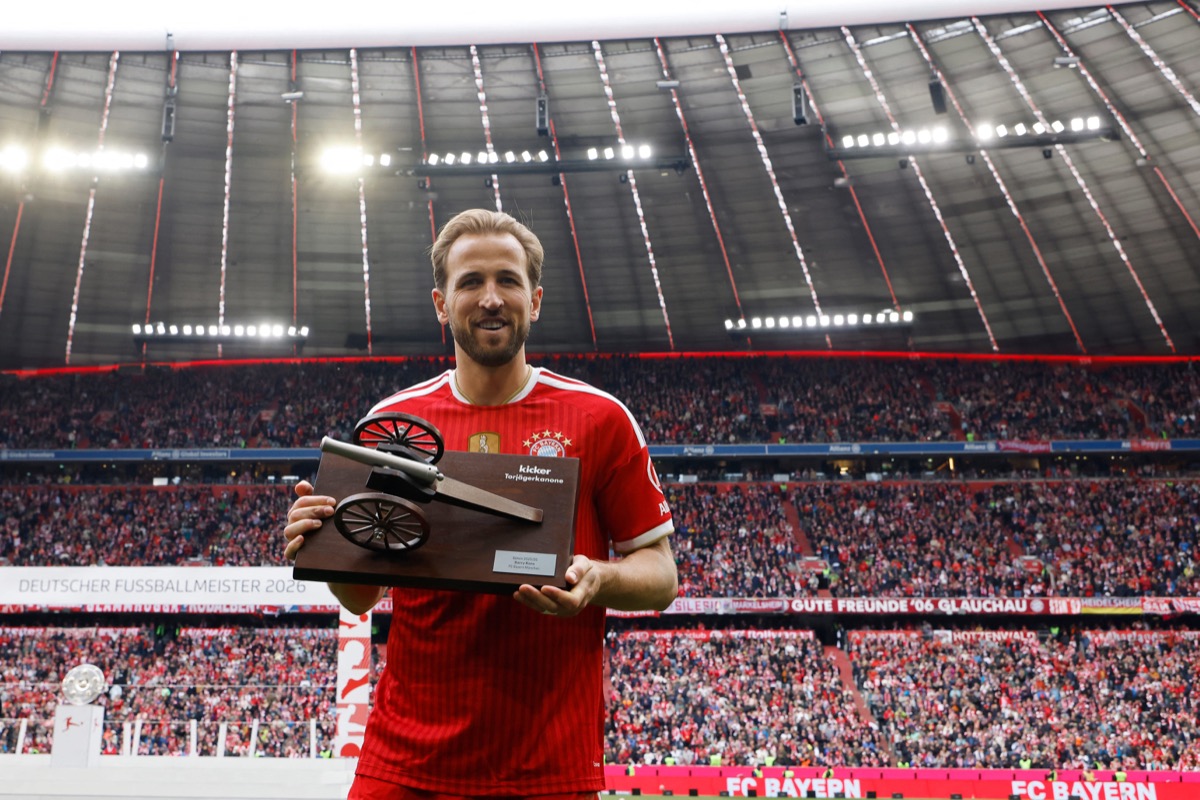
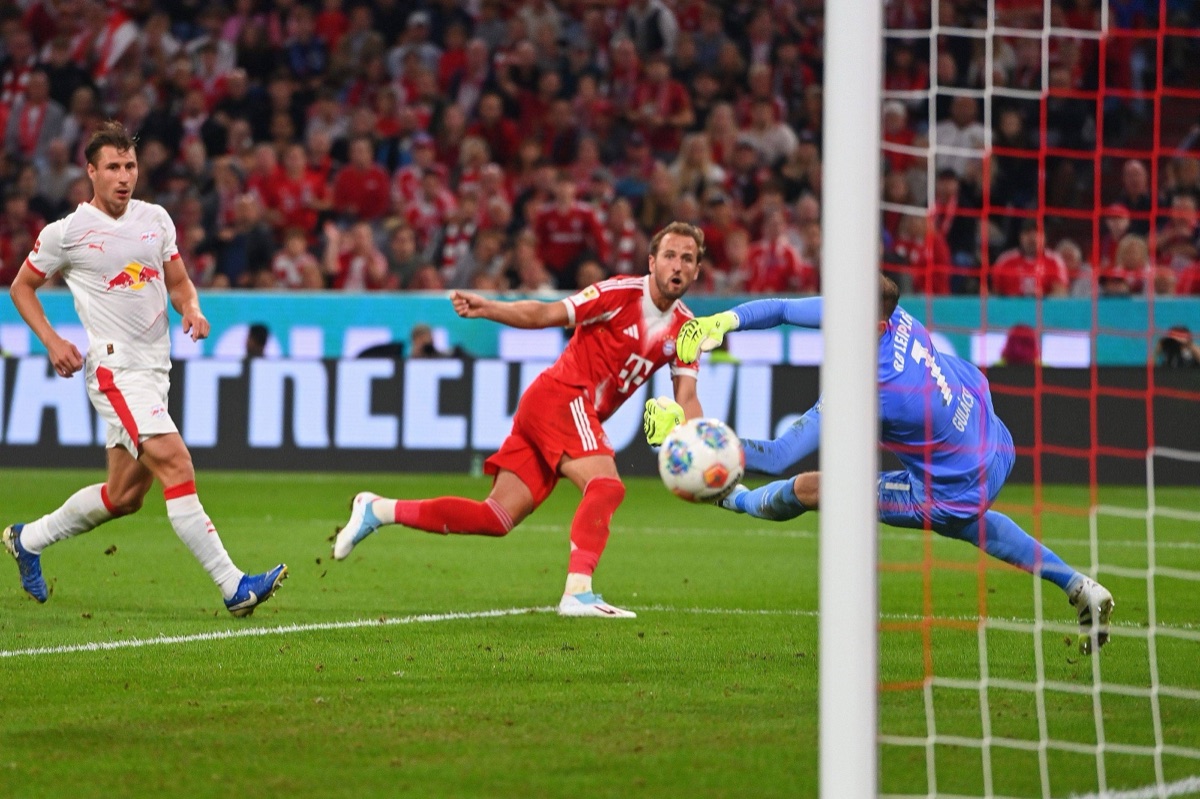
At Tottenham, his 267th goal beat Manchester City and took him past Jimmy Greaves. He finished with 280 in a Spurs shirt. In 2025/26 he put away 36 in 31 Bundesliga appearances, one every 66 minutes. That was nearly three in ten of Bayern’s 122 league goals. It was his third straight Bundesliga scoring title and the season that earned him the Ballon d’Or.
Paris · 2025 and 2026
Liverpool went out without scoring. Bayern put five past Paris across two legs and still went out. PSG kept the Champions League trophy and won Ligue 1 with 76 points.
See PSG’s league season
Manchester · 2016–26
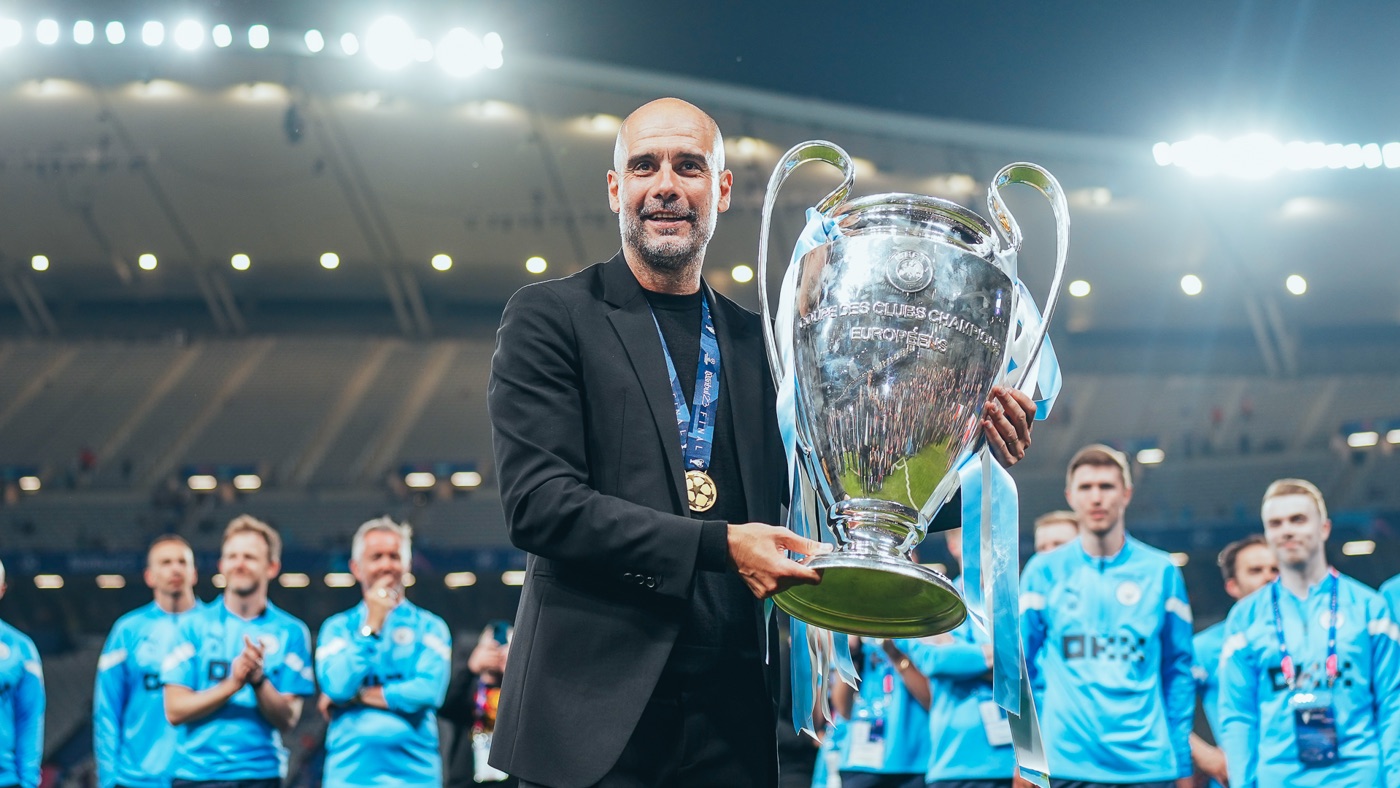
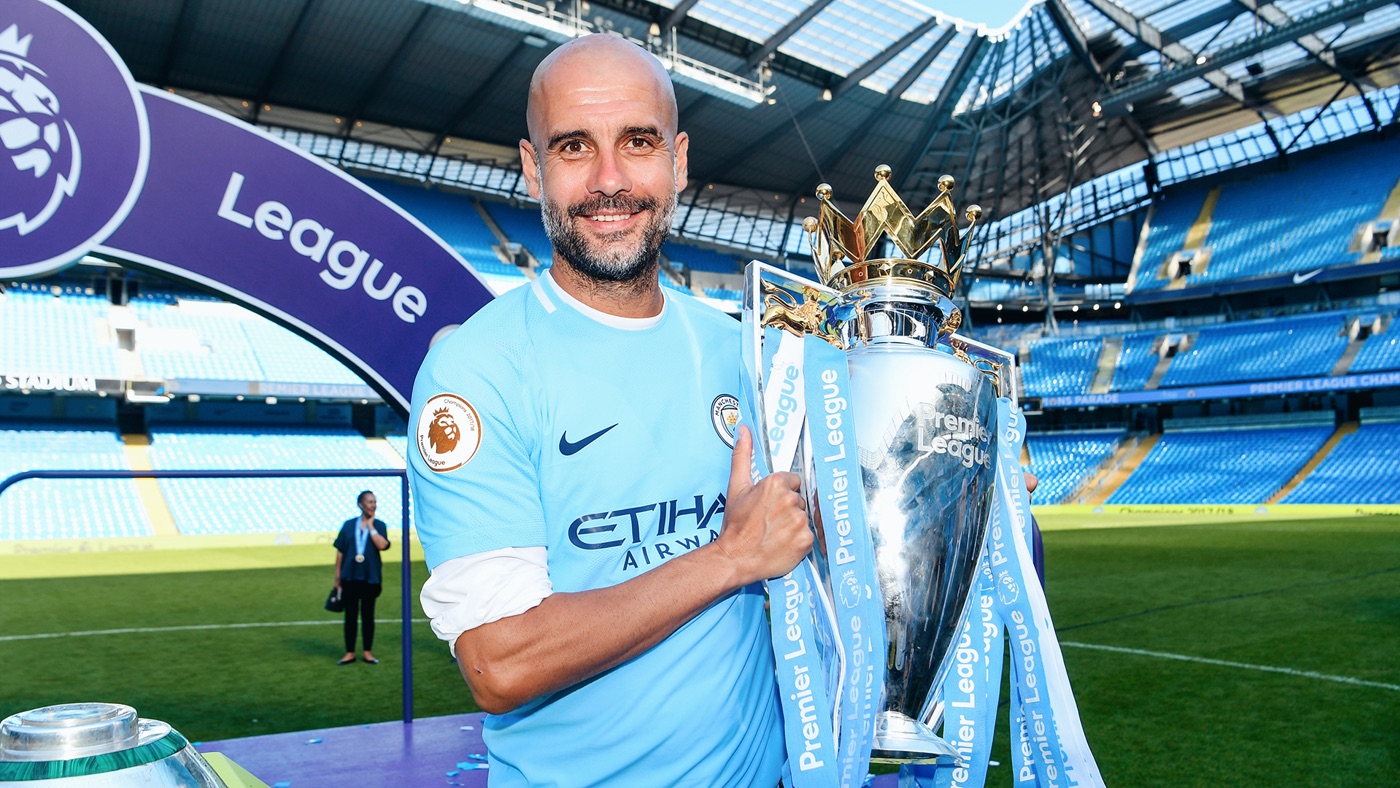
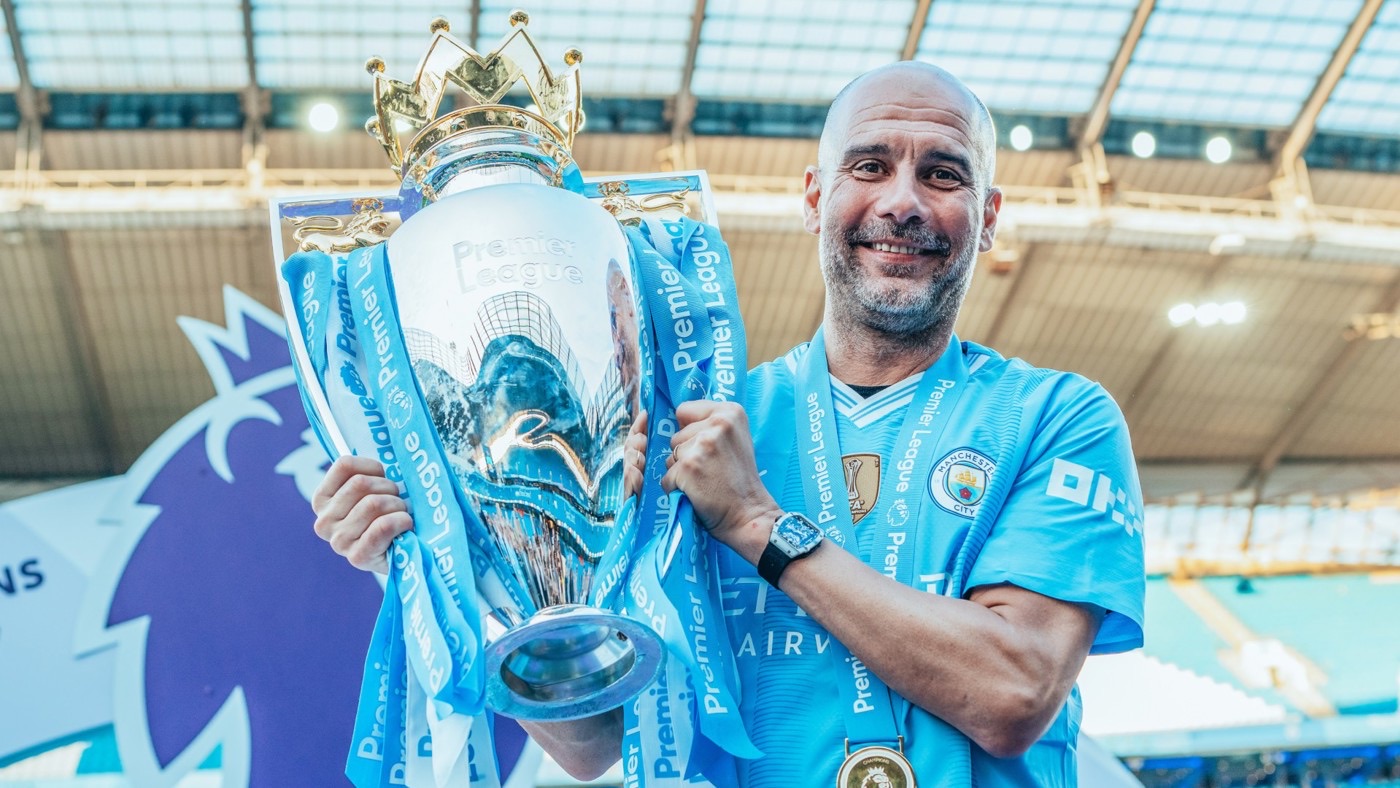
City reached 100 points in Guardiola’s second season. A year later, 98 was enough to beat Liverpool by one. Six league titles in a decade, with the last four coming in a row.
02 / Season centre
Explore 2026/27 results, compare recent form, and revisit eleven completed seasons.
Loading season data…
03 / Match replay
Spurs were still losing in the 95th minute at Leicester. Madrid were two up inside 14 minutes at Montjuïc. Bayern went in three down at Mainz. Pick a match and run the clock to the moment it turned.
Selected stoppage-time goals use the published match reports. The event log can group other stoppage-time events under 45′ or 90′.
04 / The match clock
The first 15 minutes of Premier League matches yielded 121 goals in 2025/26. From the 76th minute on, there were 270. That’s a decent case for staying in your seat.
Home win rate when the home side led at half-time.
Home win rate when the home side trailed at half-time.
Share of goals recorded in the final 15-minute bucket, which includes stoppage time.
These figures use 19,758 matches whose goal logs reconcile with the final score. Open Goal clock in the season centre to compare individual leagues and seasons.
05 / The transfer market
Among signings with recorded league minutes, the median was 1,915.5 minutes at €30M or more and 765 below €1M. The middle halves overlap. Plenty of cheaper signings got more time on the pitch.
The 2015/16–2024/25 sample starts with 4,024 positive-fee moves. 4,006 had an eligible observation window, and 3,548 link to usable league minutes. Each window covers up to 365 days and ends early at a recorded departure or return.
06 / The database
The SQL connects fixtures, clubs and appearances by ID, keeps transfer fees separate from estimates, and checks event scores against match results. View the SQL source on GitLab.
One row per league
One row per fixture
One row per player and fixture
SELECT m.season, COUNT(*) AS appearances,
       SUM(a.goals) AS goals, SUM(a.minutes_played) AS minutes,
       ROUND(SUM(a.minutes_played) * 1.0 / NULLIF(SUM(a.goals), 0), 1) AS minutes_per_goal
FROM project.matches AS m
JOIN project.appearances AS a USING (game_id)
WHERE m.competition_id = 'L1'
  AND m.season BETWEEN 2023 AND 2025
  AND a.player_id = 132098
  AND a.player_club_id = 27
GROUP BY m.season
ORDER BY m.season;This started as a team project in Database Management Systems at UT Dallas. We cleaned football data, wrote SQL to ask questions about it, and turned the results into a Tableau dashboard for class. I carried that work into the Football Archive, adding the live season centre, match timelines and stories you can explore here.